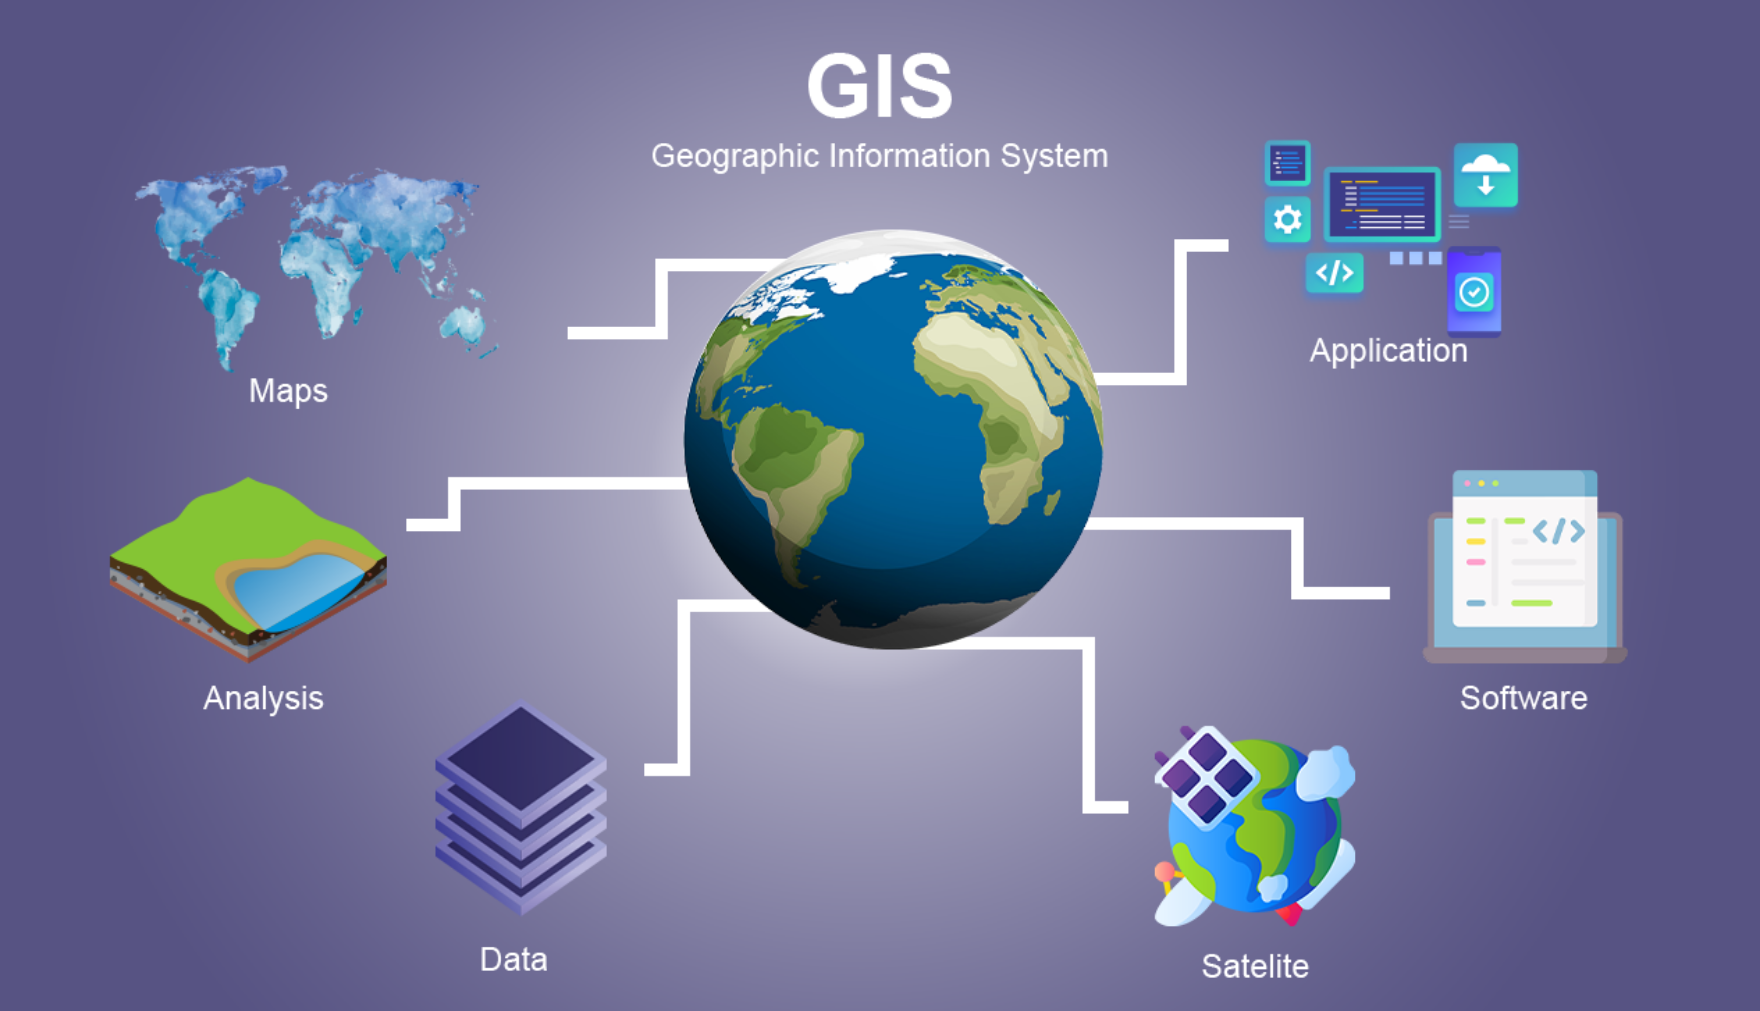
GIS
Geographic Information System
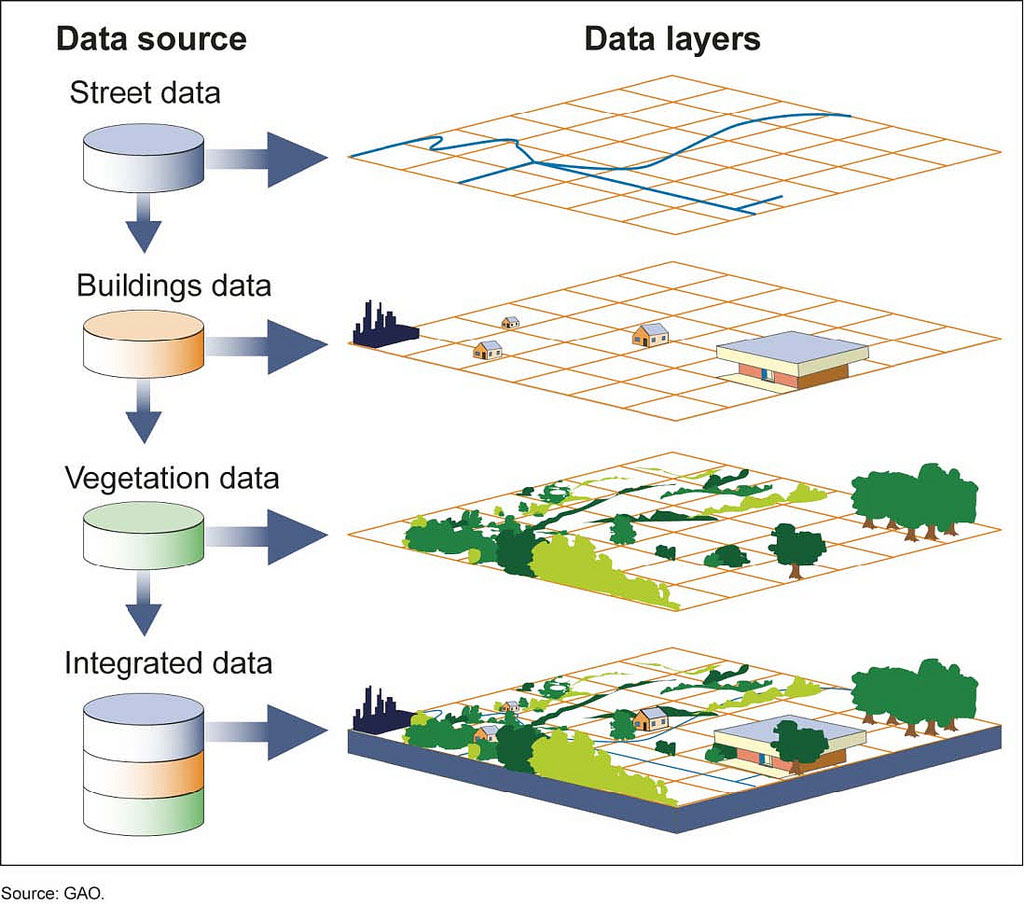
A geographic information system (GIS) is a computer system for capturing, storing, checking, and displaying data related to positions on Earth’s surface. GIS can show many different kinds of data on one map, such as streets, buildings, and vegetation. This enables people to more easily see, analyze, and understand patterns and relationships.
GIS technology is a crucial part of spatial data infrastructure, which the White House defines as “the technology, policies, standards, human resources, and related activities necessary to acquire, process, distribute, use, maintain, and preserve spatial data.”
GIS can use any information that includes location. The location can be expressed in many different ways, such as latitude and longitude, address, or ZIP code.
Many different types of information can be compared and contrasted using GIS. The system can include data about people, such as population, income, or education level. It can include information about the landscape, such as the location of streams, different kinds of vegetation, and different kinds of soil. It can include information about the sites of factories, farms, and schools, or storm drains, roads, and electric power lines.
With GIS technology, people can compare the locations of different things in order to discover how they relate to each other. For example, using GIS, a single map could include sites that produce pollution, such as factories, and sites that are sensitive to pollution, such as wetlands and rivers. Such a map would help people determine where water supplies are most at risk.
GIS technology can be used to display spatial relationships and linear networks. Spatial relationships may display topography, such as agricultural fields and streams. They may also display land-use patterns, such as the location of parks and housing complexes.
Linear networks, sometimes called geometric networks, are often represented by roads, rivers, and public utility grids in a GIS. A line on a map may indicate a road or highway. With GIS layers, however, that road may indicate the boundary of a school district, public park, or other demographic or land-use area. Using diverse data capture, the linear network of a river may be mapped on a GIS to indicate the stream flow of different tributaries.
GIS must make the information from all the various maps and sources align, so they fit together on the same scale. A scale is the relationship between the distance on a map and the actual distance on Earth
Often, GIS must manipulate data because different maps have different projections. A projection is the method of transferring information from Earth’s curved surface to a flat piece of paper or computer screen. Different types of projections accomplish this task in different ways, but all result in some distortion. To transfer a curved, three-dimensional shape onto a flat surface inevitably requires stretching some parts and squeezing others.
A world map can show either the correct sizes of countries or their correct shapes, but it can’t do both. GIS takes data from maps that were made using different projections and combines them so all the information can be displayed using one common projection.
See more to know